I think even you do monitor and collect performance metrics (whitebox monitoring), you also need "blackbox" monitoring, which is necessary in many cases.
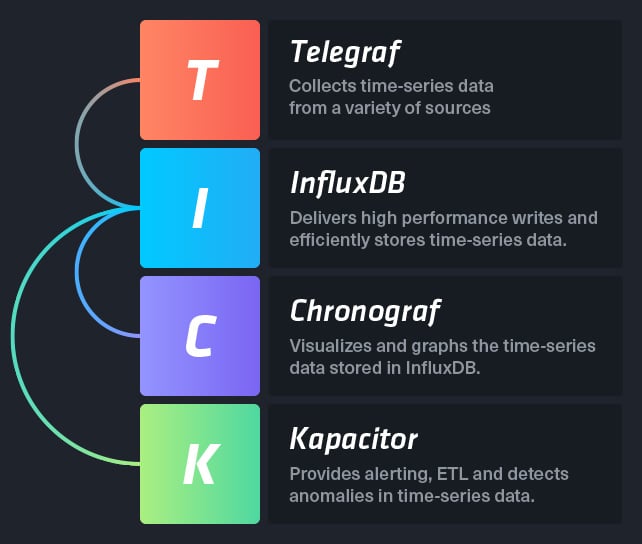
Since right now I use TICK Stack for monitoring (time-series instead old Nagios style), as usual I had tried to find a Telegraf plugin to achieve that goal, and I found one, which is "procstat".
In fact it's a nice plugin, and it even has more than what I need, but unfortunately it has a bug! It reports wrong PIDs, because it caches the PIDs, and sometime original process finishes, and the system gives that PID to a new process (which is normal, since the system recycles PIDs when process exits).
The other solution is making your own script and execute it via Telegraf plugin "exec"!
So I decided to write a Python script that do the same thing. But it just reports the process themselves because I just need blackbox monitoring here (so no performance metrics).
Python
I create a Python script that checks list of processes and print their status in InfluxDB format.You can find the code on GitHub: procCheck-telegraf-influxdb.
Unlike "procstat" which uses "pgrep", I tried to make this script pure Python. And even I didn't use an external module like "psutil" which totally fits here (but also it's not part of default system packages and you need to install it). But since I don't need most of its features and this script will run on Linux systems only, so that's ok for me right now.
Beside monitoring processes based on "name" (i.e exec/bin name), this script also supports monitoring a pattern! So it works with Java apps too! In java apps (e.g. ZooKeeper, Kafka, etc), the binary name for all processes is just "java", and the real application shows as argument for that java process.
So let's assume that we have the following in our procList.yml:
# Process name.
byName:
  - sshd
  - vnc

# Fixed string.
byString:
  zookeeper: "org.apache.zookeeper.server.quorum.QuorumPeerMain"

# Regular expression.
byRegex:
  nginx_master: "nginx: master process .+nginx.+"
And I just test it on normal desktop machine (Ubuntu 16.04), and there is no "sshd", so the output will be like this:
procCheck,host=LinuxRocks,process_name=sshd,exe=sshd,pid=2814 host=LinuxRocks,process_name="sshd",exe="sshd",pid=2814,pattern="",matched_regex=""
procCheck,host=LinuxRocks,process_name=zookeeper,exe=java,pid=3546 host=LinuxRocks,process_name="zookeeper",exe="java",pid=3546,pattern="org.apache.zookeeper.server.quorum.QuorumPeerMain",matched_regex=""
procCheck,host=LinuxRocks,process_name=nginx_master,exe=nginx,pid=5798 host=LinuxRocks,process_name="nginx_master",exe="nginx",pid=5798,pattern="nginx: master process .+nginx.+",matched_regex="nginx: master process /usr/sbin/nginx -c /etc/nginx/nginx.conf"
Telegraf
For Telegraf we will use a separated config file and put it in Telegraf config dir:/etc/telegraf.d/proccheck.conf
Then all what you need here is just specifying the output (a separated database will be used for processes data).
###############################################################################
#                                  OUTPUTS                                    #
###############################################################################

# Configuration for influxdb server to send metrics to
[[outputs.influxdb]]
  # The full HTTP or UDP endpoint URL for your InfluxDB instance.
  # Multiple urls can be specified but it is assumed that they are part of the same
  # cluster, this means that only ONE of the urls will be written to each interval.
  # urls = ["udp://localhost:8089"] # UDP endpoint example
  # urls = ["http://localhost:8086"] # required
  urls = ["http://10.10.10.10:8086"] # required
  # The target database for metrics (telegraf will create it if not exists)
  database = "processes_status" # required.
  # Precision of writes, valid values are n, u, ms, s, m, and h
  # note: using second precision greatly helps InfluxDB compression
  precision = "s"

  # Connection timeout (for the connection with InfluxDB), formatted as a string.
  # If not provided, will default to 0 (no timeout)
  timeout = "30s"
  username = "processes_status"
  password = "IUu3MbjIPPLBE"
  # Set the user agent for HTTP POSTs (can be useful for log differentiation)
  # user_agent = "telegraf"
  # Set UDP payload size, defaults to InfluxDB UDP Client default (512 bytes)
  # udp_payload = 512

  # This metrics only will go to processes database.
  namepass = ["procCheck*"]

###############################################################################
#                                  INPUTS                                     #
###############################################################################
[[inputs.exec]]
  # Shell/commands array
  # compatible with old version
  # we can still use the old command configuration
  # commands = ["/usr/bin/line_protocol_collector","/tmp/test2.sh"]
  # command = "/usr/bin/line_protocol_collector"
  command = "/usr/lib/telegraf/scripts/proccheck/procCheck.py"

  # Time interval for this command.
  interval = "1m"

  # Data format to consume.
  # NOTE json only reads numerical measurements, strings and booleans are ignored.
  data_format = "influx"
Kapacitor
Right now we are monitoring a process or a list of processes and send their data via Telegraf to InfluxDB. What we are going to do now is using Kapacitor (which is for time-series data processing, alerting, and anomaly detection) to get alerts when one of process is stopped.Here is a TICK script, that uses dead man's switch, so you will get an alert when the monitored process is not there anymore.
What this TICK script is actually doing is making a batch queries (I think we don't need "stream" here), and if there is no data for any monitored process it will send and alert via "VictorOps".
Of course you can uses whatever you use for altering, just check supported services in alerting. And if it's not there you can consume that data using "HTTPOut".
batch
    // Counting will work fine for any column, since "count" just counts number of rows.
    // So the column "process_name" itself is not important here.
    |query('''
        SELECT count("process_name") as query_value
        FROM "processes_status"."30D"."procCheck"
    ''')
        .period(2m)
        .every(1m)
        .fill('null')
        .groupBy(time(1m), 'process_name', 'host')

    |deadman(0.0, 1m)
        // Alert title.
        .id('Monitored processes - {{ index .Tags "process_name" }}')

        // Alert body.
        .message('Server:{{ index .Tags "host" }}|Process {{ index .Tags "process_name" }} STOPPED!')

        // Send notification when state changes only.
        .stateChangesOnly()

        // Send alerts to VictorOps.
        .victorOps()
        .routingKey('everyone')

        // For Debugging purposes.
        //.log('/tmp/kapacitor_procscheck.log')
As a DevOps guy, I'm really in love with TICK Stack! It's AWESOME! :-)


